In the previous post I stated that continuous improvement is a recurring process aimed at improving the performance of the company. By further developing this concept, it can be said that to produce an improvement it is necessary to change something: the Map of Objectives that I introduced in the first part serves, precisely, to define what to change and, above all, what not to change. It may seem paradoxical but, if you think about it, simply preventing us from doing what should not be done is a "change" that produces improvement effects.
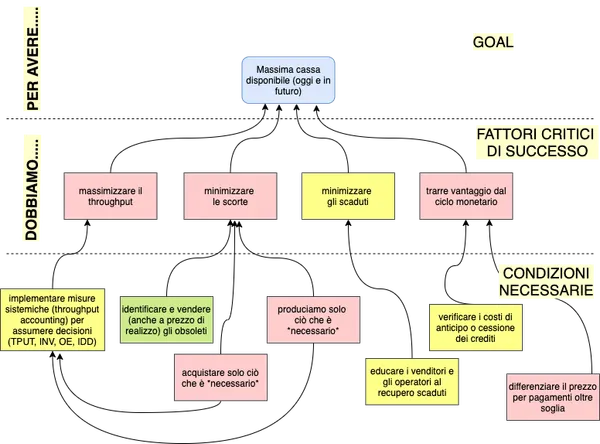
From this point of view, the Goal Map represents an extraordinary strategic tool; in fact, if well built, it allows you to establish (and communicate) with extreme clarity what you want to achieve and what you need to change (or improve, or introduce) to get it. Just look at the following example:
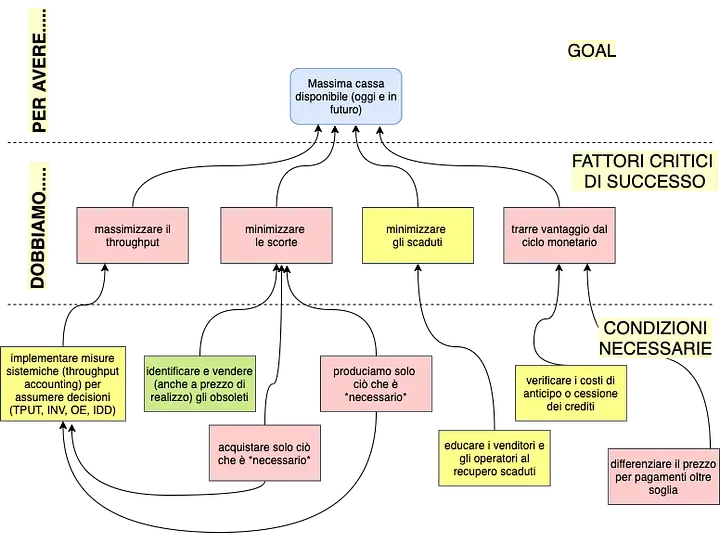
by going through it is immediately clear, for example, that submitting a purchase order because a supplier proposes a special campaign is an operation to be carefully evaluated, as well as keeping obsolete products in stock or producing what is not strictly necessary.
Once the objectives to be pursued as a company, i.e. as a single entity, have been clarified, the next logical step becomes to understand what are the obstacles that prevent its completion. In this regard, ToC provides us another tool that is very useful and powerful: the Problem Map.
But first let's take a step back: as generally known, a business company can be considered a dynamic and complex system. Consequently, we can consider the main assumption of the Theory of Constraints valid, i.e. any system, at a given time, is limited by very few factors (sometimes only one).
Well: the Problem Map (or CRT, Current Reality Tree) is a powerful tool to verbalise and understand the cause-effect relationships that exist in the system that you want to improve; in practice, it allows those who do the analysis to examine the main "symptoms" that impact the system and, starting from these, based on sufficiency logic, highlight the dependencies (in some cases not exactly obvious or immediately perceptible), to come to define the true causes. To use a metaphor, it's a bit like being a doctor who, by collecting information about the patient's symptoms, forms an overall picture that leads him to formulate his diagnosis.
The logic we apply, as mentioned, is a logic of sufficiency in that a certain event, a given entity can derive from one or more causes, which act separately or together. To give an example:
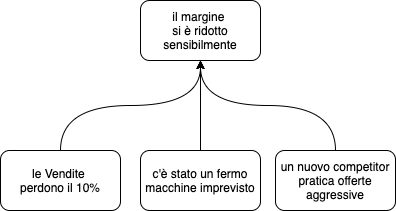
As shown in Figure 2, the entity "the margin has decreased significantly" can be caused by any of the 3 causes, regardless of the others. In the case shown in figure 3 below, however, the entity "we often deliver late" is the result of the combined action of B and C. To clarify: the fact of often changing the priorities of orders, in itself, does not necessarily produce as a consequence "we often deliver late"; but if we combine with the first cause the fact that "Murphy" (to learn more about the term "Murphy" click here) usually strikes without warning, then the two causes together become capable of producing, inevitably, the observed effect.

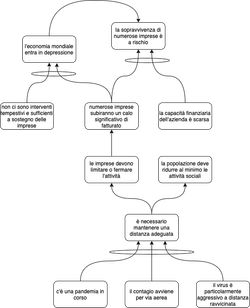
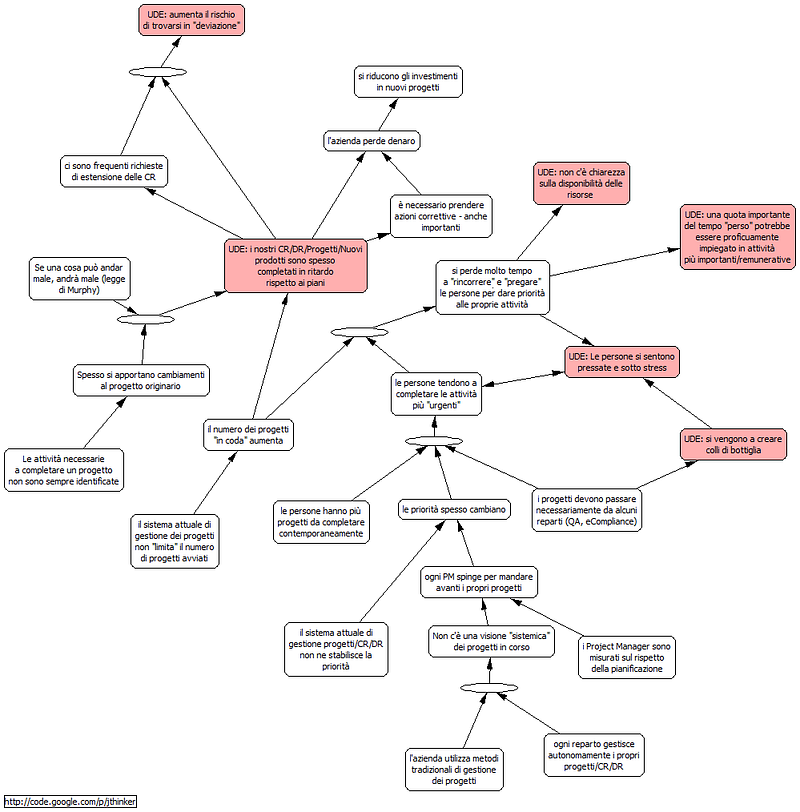
Back to the topic, the CRT is a very valuable tool that allows us to understand where to act, avoiding us to disperse energy and resources in an attempt to improve our system: we start with a list of unwanted effects that we will then link together, pushing us deeply towards the few factors that, as mentioned, are responsible for most of the effects. Here is an example, in which you can see, in red, the side effects (UDE) related to each other.
To learn more, do not hesitate to contact us by clicking here. And if you want to continue on our path of continuous improvement, keep following us. See you next post!