GESTIRE PROGETTI CON SUCCESSO
LYNX by A-Dato helps you eliminate conflicts and manage priorities across all your projects. It allows you to handle priorities and keep information in sync at a system-wide level, creating a positive environment and, most importantly, getting results!
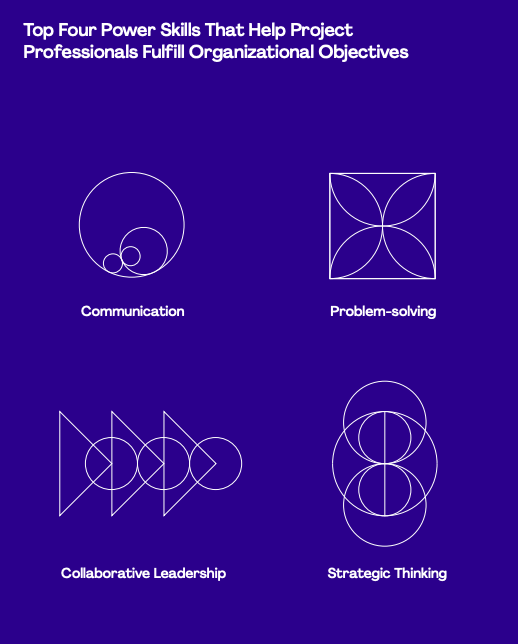
Download TrialAccording to a 2023 PMI report, projects are negatively impacted by many factors that can stop them from succeeding. However, when companies prioritize the development of "power skills," 72% of their projects are completed successfully and meet business requirements. Conversely, for companies that pay little attention to these skills, the success rate drops to 65%.
Project Problems
Even in the best-case scenario, nearly one in three projects can be considered a failure. So, what are the common problems projects face? They can basically be broken down into two categories:
- Planning problems
- Execution problems
Planning Problems
One of the most obvious issues in project management is planning. Projects are almost always planned using "traditional" methods based on duration estimates, with set start and end dates for each task.
The problem with this approach is that these estimates almost always include a "safety margin". The person estimating the time needed to complete a task tends to pad the estimate to account for potential issues like breakdowns, delays, or changes in priority.
Additionally, using fixed start and end dates for tasks is a planning method that simply can't be followed perfectly. What are the chances that every single task in a project will start and finish exactly on schedule? Very low. And what's the chance that if one task finishes early, the next one will start ahead of schedule? Zero.
As a result, any delay will accumulate and affect the project's overall duration, while finishing early won't.
Execution Problems
In a single-project environment, it's relatively easy to monitor and control the various tasks. But in a multi-project environment, things get complicated, and it becomes very difficult to figure out where to intervene when needed.
The CCPM Planning Solution
The planning concept used in Critical Chain Project Management (CCPM) is tied to a more "holistic" view of the project. As we mentioned, traditional estimates account for potential problems and delays. That's great, but what's the point of keeping that safety time at the individual task level when our job should be to protect the entire project?
To put it simply, the goal isn't to make sure every task starts and ends on schedule; it's to make sure the entire project starts and finishes on time!
So, how do we do that? It's simple. We borrow a concept from "mutual insurance": you ask for a little bit of money from everyone to help those who need it.
In the case of projects, we remove a portion of the estimated time from each individual task and put it into a single project-level container called a project buffer. When a delay happens, we can "virtually" take those days from the buffer. Of course, if a task finishes early, the buffer isn't touched at all.
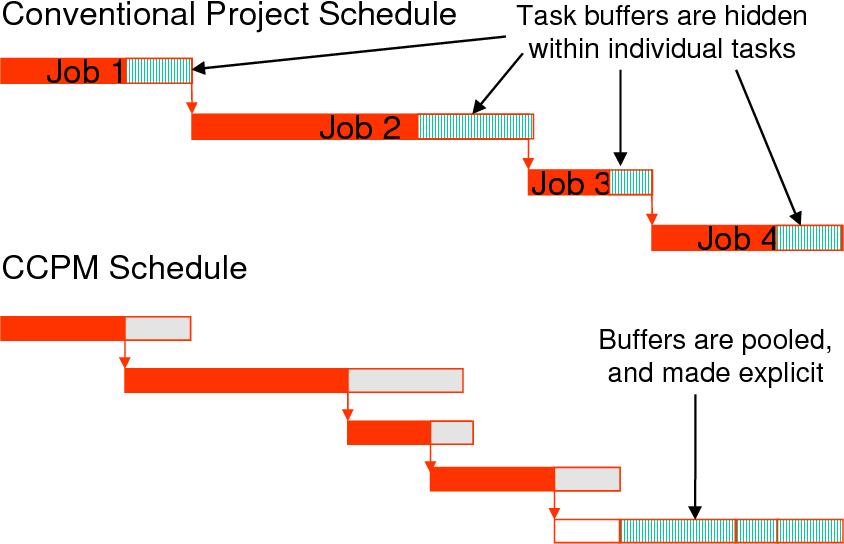
There's definitely less stress involved with having to monitor the start and end of every single task. As we said, the goal is to protect the entire project, and the buffer lets you do that by giving you just one indicator to watch instead of many.
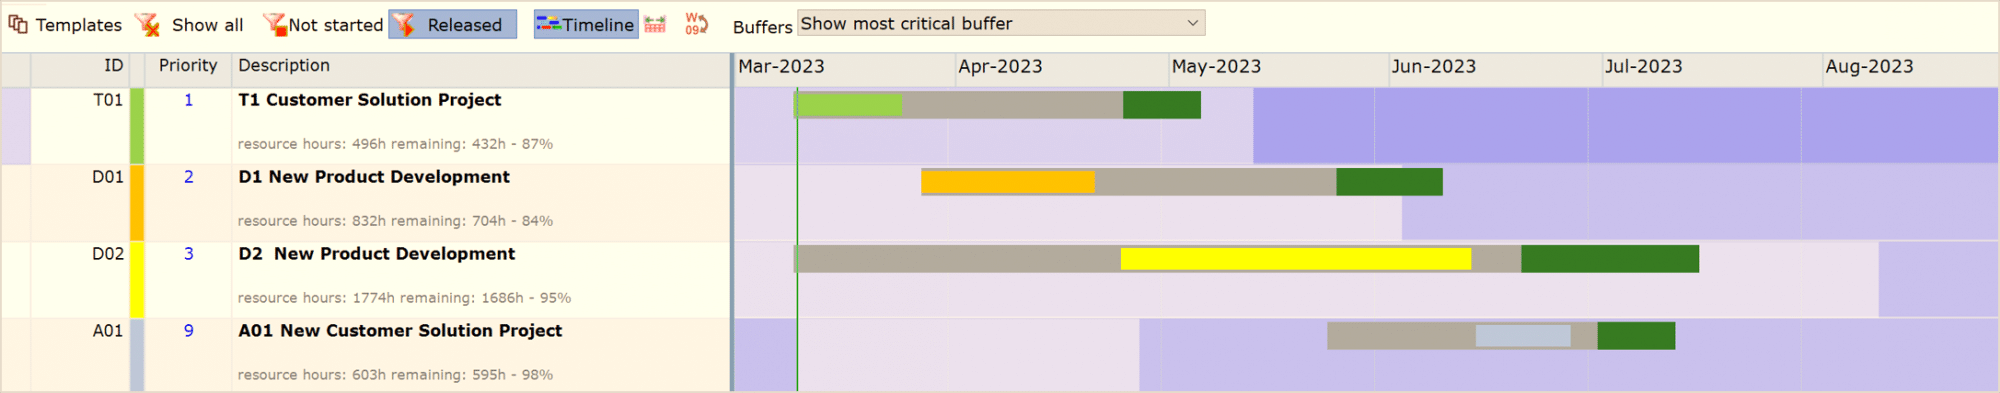
Execution with CCPM Buffers
The buffer is also extremely useful during a project's execution. By monitoring how much of the buffer is used compared to the project's completion percentage, you can analyze the project's progress using a traffic light indicator.
By dividing the buffer into three distinct sections, you can quickly see if a deviation from the estimate is normal, acceptable, or abnormal.
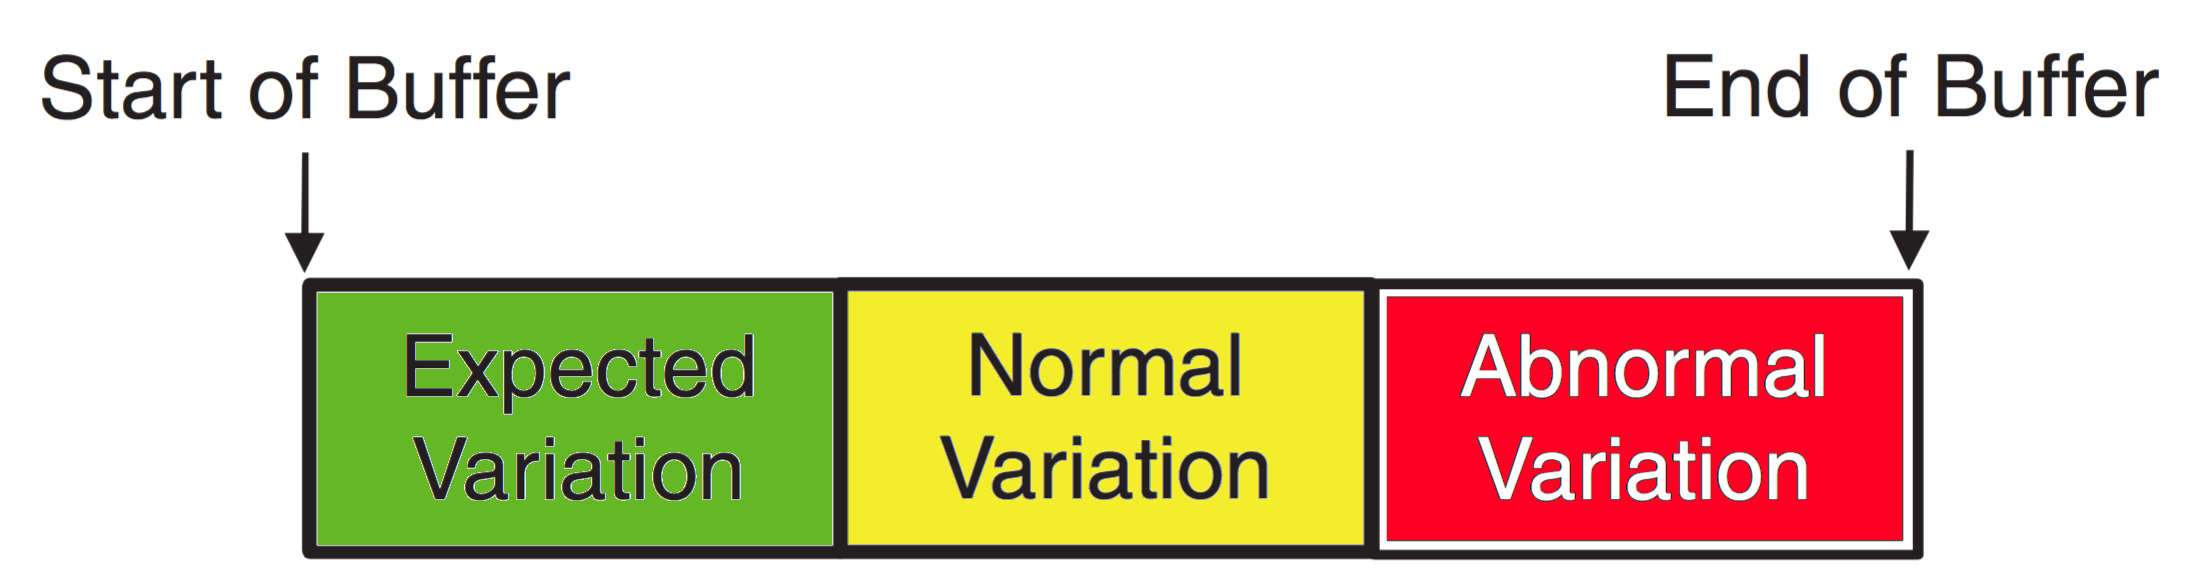
This way, you can immediately tell if a project is doing well (in the green zone) or poorly (in the red zone). If it moves into the yellow zone, you should look into whether the situation is likely to get worse and what you can do to fix it.
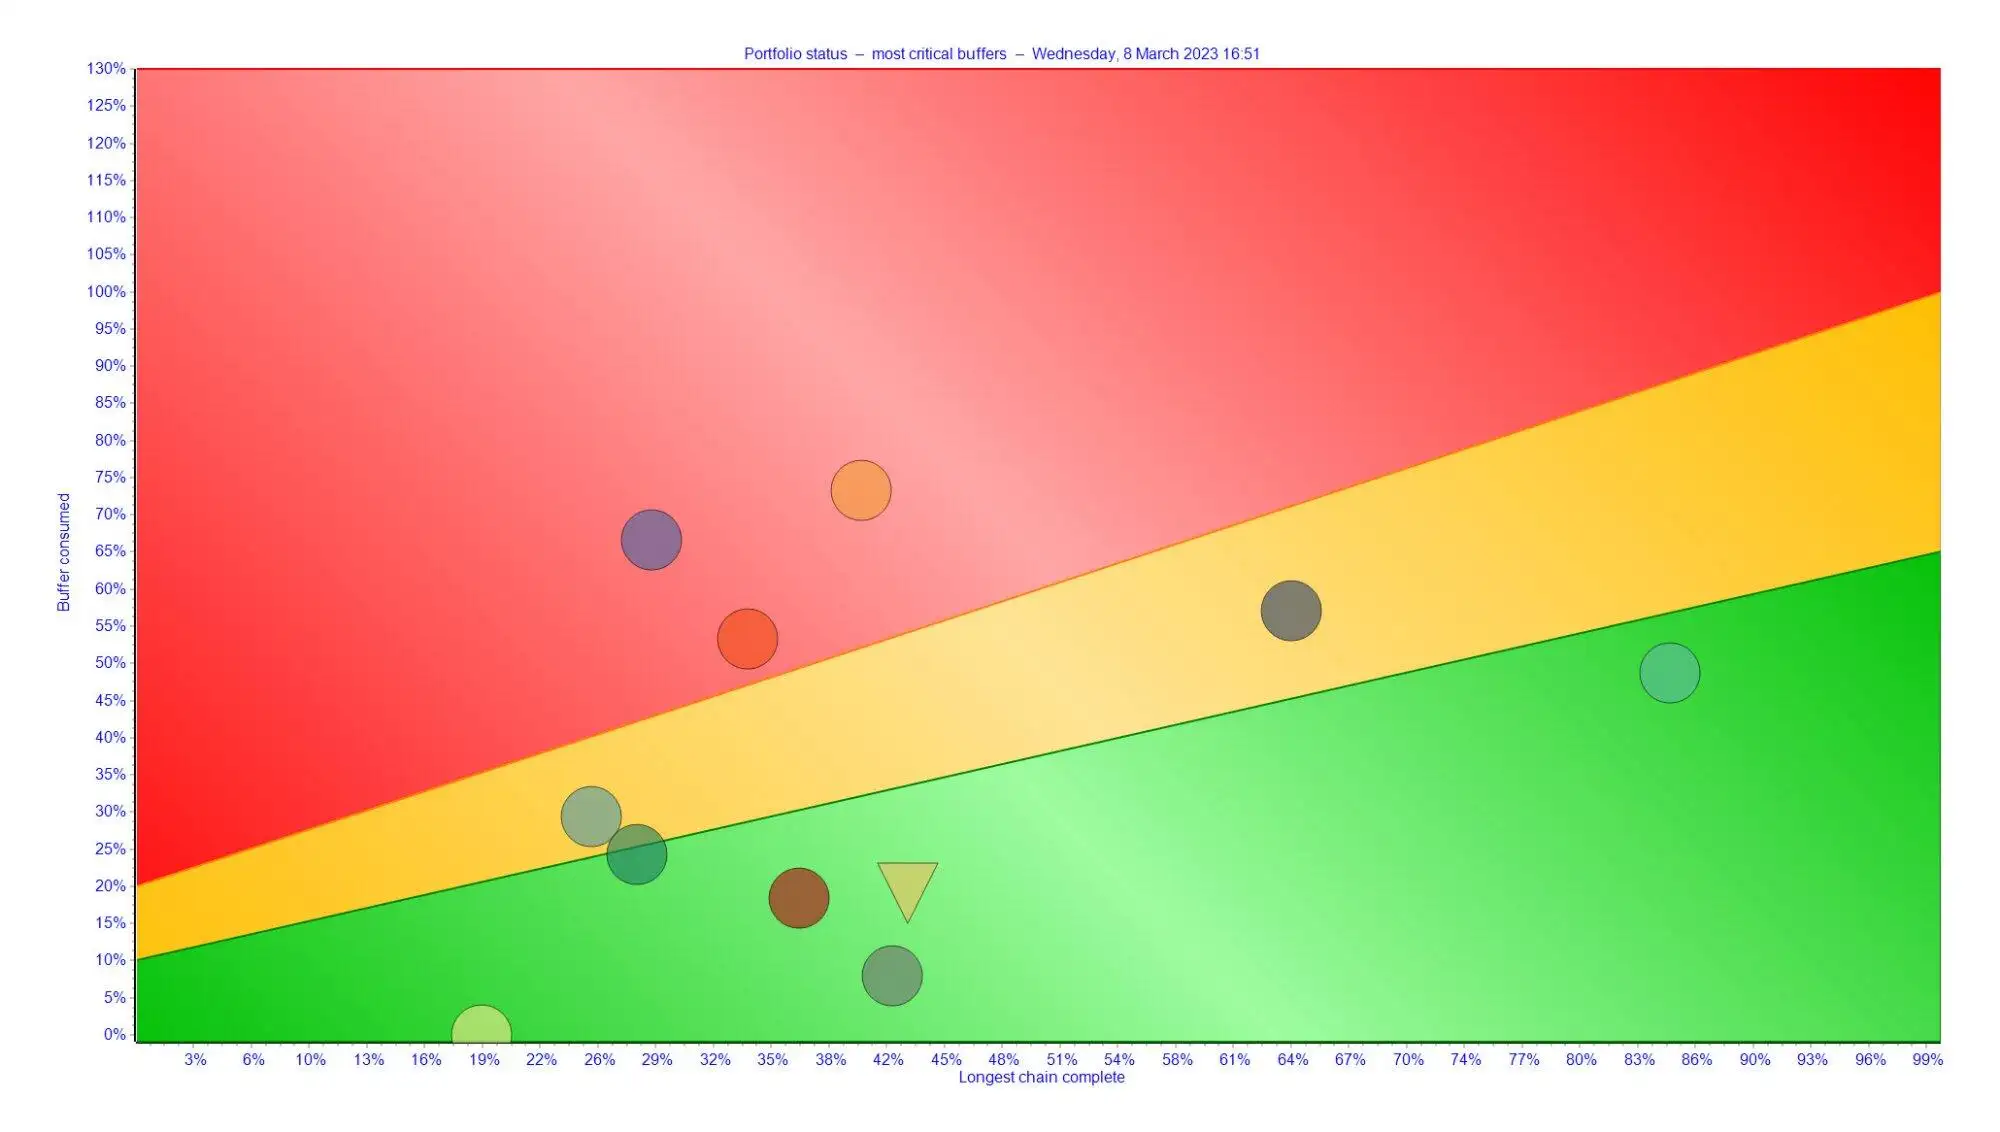
By using the buffers from each project, you can also create a useful graph for management or anyone overseeing a portfolio of projects. This "fever chart" plots all ongoing projects as individual points, positioned based on their buffer consumption compared to their project completion percentage.
Want to learn more? Maybe to see if CCPM is right for your company? Contact us or leave a comment. To get a free trial, fill out the form by clicking the button below